This technical SEO: the Core Web Vitals & page experience playbook is your roadmap to mastering the three metrics that truly define a modern user experience: Largest Contentful Paint (LCP), Interaction to Next Paint (INP), and Cumulative Layout Shift (CLS). As primary ranking signals, improving these metrics isn't optional anymore. It’s a direct line to better rankings, deeper engagement, and more sales, providing a solid foundation for your search engine optimization strategy.
Why Core Web Vitals Are Your New SEO Foundation
In the competitive Australian market, a fast, responsive, and stable website isn't just a nice-to-have—it's the bedrock of your entire SEO strategy. Google's Core Web Vitals (CWV) are a specific set of metrics designed to measure the real-world experience a person has on your site, acting as critical ranking signals that can significantly impact your search visibility.
Think of it as Google's way of asking: "Does this page feel fast and is it actually easy to use?"

These metrics are a huge part of the broader Page Experience signals, which also cover things like mobile-friendliness, HTTPS security, and not having annoying pop-ups. But honestly, it's the Core Web Vitals that usually pose the biggest technical challenge—and offer the greatest chance to get ahead of the competition. Mastering LCP, INP, and CLS is central to modern technical SEO.
Translating Metrics Into User Experience
It’s easy to get lost in the alphabet soup of LCP, INP, and CLS. The key is to connect these numbers to what a visitor actually sees and feels when they land on your site.
- Largest Contentful Paint (LCP): This is all about loading performance. It clocks the moment the most important content—usually a hero image or the main text—appears on screen. A fast LCP tells the user, "Yep, you're in the right place, and things are happening."
- Interaction to Next Paint (INP): This measures responsiveness. It tracks the lag between a user's action (like clicking a button) and the page visually reacting. A low INP makes your site feel snappy and alive.
- Cumulative Layout Shift (CLS): This tackles visual stability. It measures how much the page content unexpectedly jumps around while loading. A low CLS is what stops people from accidentally clicking the wrong button because an ad suddenly appeared.
Your goal is straightforward: hit a 'Good' score for all three Core Web Vitals. This proves your site is fast, interactive, and stable—the essential ingredients for a positive user experience that Google wants to reward.
The Business Case for Better Page Experience
Working on your Core Web Vitals isn't just a box-ticking exercise for your developers; it's a direct investment in your business's bottom line. For Australian SMBs and e-commerce stores, the link between page experience and profit is crystal clear.
A slow-loading product page (poor LCP) can send a potential customer packing before they even see what you're selling. A laggy 'Add to Cart' button (poor INP) is a recipe for frustration and abandoned carts. An unstable layout that makes someone click the wrong thing (poor CLS) just looks unprofessional and erodes trust.
By getting these metrics right, you can directly influence key business outcomes:
- Lower Bounce Rates: People stick around when a page loads quickly and feels responsive.
- Higher Conversion Rates: A smooth, stable, and fast experience removes friction from the path to purchase.
- Improved SEO Rankings: With all else being equal, strong Core Web Vitals can be the tie-breaker that pushes you above a competitor in search results.
This playbook will give you the diagnostic tools and practical steps you need to turn CWV optimisation from a headache into a genuine strategic advantage for your business.
How To Diagnose and Fix Largest Contentful Paint (LCP)
Let’s talk about that all-important first impression. Largest Contentful Paint (LCP) is the metric that measures it. In simple terms, it tracks how quickly the most important bit of content on your page—usually a big hero image or the main headline—pops into view for a visitor.
Anything over 2.5 seconds is considered slow, and honestly, that's often enough time for an impatient user to hit the back button. This isn't just some abstract number; a slow LCP can directly hurt your business. So, let's get our hands dirty and figure out what’s usually slowing things down.

Identifying Common LCP Killers
Before you can fix a bad LCP score, you’ve got to play detective. I’ve found over the years that the culprits usually fall into just a few common buckets, all related to how your server coughs up the page and how your visitor’s browser puts it all together.
Here are the usual suspects I look for first:
- Slow Server Response Times: If your server is snoozing on the job, everything else gets delayed. It’s the first and most common bottleneck.
- Render-Blocking JavaScript and CSS: Sometimes, scripts and stylesheets demand to be loaded first, essentially holding your main content hostage until they're done.
- Massive, Unoptimised Images or Videos: That stunning, high-res hero image? It's probably the most frequent cause of a poor LCP I see.
- Client-Side Rendering Hiccups: Sites that lean too heavily on JavaScript to build the page in the browser can often feel sluggish as they wait for everything to execute.
Actionable Recipes for a Faster LCP
Right, let's get into the fixes. Tackling a slow LCP is all about systematically knocking down those bottlenecks we just identified. Here are some of the highest-impact things you can do right now.
Optimise Your Server and Hosting
Your hosting is the literal foundation of your site's speed. For Australian businesses with a local audience, this one’s a no-brainer: get a high-performance Aussie host. Having servers physically located in Australia drastically cuts down latency—the time it takes for data to make the trip to your customer.
A slow Time to First Byte (TTFB) is a direct torpedo to your LCP score. A good Content Delivery Network (CDN) and a properly tuned server will get that initial response time way down, giving your page a running start.
Master Image and Media Optimisation
Images are almost always the largest element on the page, which makes them public enemy number one for LCP. Don’t just upload a beautiful photo straight from your camera and call it a day.
- Compress Images Aggressively: Switch to modern formats like WebP. It provides way better compression than old-school JPEGs and PNGs, often shrinking file sizes by 25-35% without any visible drop in quality.
- Use Lazy Loading—But Be Smart About It: Lazy loading is fantastic for images below the fold, as it stops them from loading until someone scrolls down. But whatever you do, never lazy load your main LCP element (like that hero image). That’s a guaranteed way to make your score worse.
- Serve Responsive Images: Use the
<picture>element or thesrcsetattribute. This tells the browser to serve smaller images to phones and bigger ones to desktops. It stops you from forcing a tiny mobile screen to download a giant desktop-sized file.
Tame Render-Blocking Resources
JavaScript and CSS files can literally stop a browser from painting anything on the screen. The trick is to manage their loading order so the important visual stuff can appear right away.
- Minify Your Code: Minification strips out all the useless characters (like spaces and comments) from your CSS and JavaScript files, making them smaller and faster to download.
- Defer Non-Critical JavaScript: Got a chat widget or analytics tracker? Those scripts don't need to load upfront. Load them asynchronously or defer them so they don’t get in the way of your main content.
- Inline Your Critical CSS: This is a pro move. Figure out the bare minimum CSS needed to style what people see without scrolling. Then, stick that code directly into the
<head>of your HTML. The browser can then render that first view instantly, without having to wait for a separate stylesheet to download.
By mastering LCP as a primary ranking signal, you set the stage for a positive user experience from the very first second. The strategies in this technical SEO playbook are designed to deliver immediate, measurable improvements to your site's loading performance, directly impacting user satisfaction and search engine rankings.
A Practical Guide to Nailing Interaction to Next Paint (INP)
If Largest Contentful Paint (LCP) is the first impression, Interaction to Next Paint (INP) is the ongoing conversation. It’s all about your website’s real-time responsiveness. INP measures the frustrating delay between a user’s action—like clicking a button or tapping a form field—and the very next moment the page visually reacts.
A good INP score is 200 milliseconds or less. Anything above that starts to feel sluggish, and once you get into higher numbers, your site can feel downright broken. This isn't just some abstract number; it's a direct measure of how fluid and professional your site feels to a real person.
For many Australian ecommerce sites, a poor INP is a silent conversion killer. Picture a customer trying to add a hot product to their cart, but the button just hangs there for a second. That tiny hesitation is often all it takes to plant a seed of doubt and send them clicking away to a competitor.
Hunting Down What's Causing Poor INP
A high INP score almost always points to one thing: an overworked main thread in the browser. Think of the main thread as a single-lane road. It has to handle everything from drawing the page to running JavaScript and reacting to clicks. When a big, slow truck gets on that road, everything grinds to a halt behind it.
The most common culprits creating these digital traffic jams are:
- Long-running JavaScript tasks: Heavy calculations, complex data processing, or just plain bulky scripts can hog the main thread, leaving no room for the browser to deal with user input.
- Inefficient event handlers: The code that runs when someone clicks a button or presses a key can be poorly written, taking far too long to finish and causing that noticeable delay.
- Heavy third-party scripts: Those live chat widgets, analytics trackers, and social media embeds are incredibly useful, but they often come with a hefty JavaScript cost that can slow your entire site to a crawl.
- A massive DOM: When a page has an overly complex structure with thousands of elements, it makes every visual update much more work for the browser. This slows down the "paint" part of INP.
A Checklist for Diagnosing INP Bottlenecks
To fix a bad INP, you need to put on your detective hat. Your best tool for the job is the Performance panel in your browser’s developer tools (I personally use Chrome DevTools).
Here’s a practical way to pinpoint what's causing the slowdown:
- Record a real interaction: Open the Performance panel and hit the record button. Now, go and perform the specific action on your site that feels slow—a good example is clicking a ‘filter’ button on a busy category page.
- Scan the flame chart: Once you stop the recording, look at the "Main" thread section of the chart. You're hunting for long tasks, which are often flagged with a red triangle. These are scripts that take more than 50 milliseconds to run and are your prime suspects for blocking responsiveness.
- Find the guilty script: Click on one of those long tasks. Down in the summary panel, the "Bottom-Up" tab will show you exactly which JavaScript functions are eating up all the processing time. Now you know precisely where to focus your optimisation efforts.
Practical Fixes for an Instantly Responsive Site
Once you’ve identified the source of the delay, it's time to roll up your sleeves. Improving your INP score is all about lightening the load on that main thread and writing more efficient code.
Break Up Your Complex JavaScript
You don’t have to run a huge, complex task all at once. The trick is to slice it into smaller, more manageable chunks. Doing this gives the browser a chance to breathe and handle user interactions between each piece of work.
- Use
setTimeout: A really straightforward way to yield back to the main thread is to wrap parts of your long-running function insetTimeout. This basically tells the browser, "Run this small bit of code, then take a quick break to see if the user has done anything, then you can run the next bit." - Leverage
requestIdleCallback: This is a more sophisticated method that schedules your functions to run only when the browser is completely idle. It's absolutely perfect for low-priority background work that shouldn't get in the way of the user experience.
Pro Tip: Think of a long JavaScript task like someone trying to tell a very long, boring story at a party without taking a breath. By breaking it into smaller, more interesting anecdotes (yielding to the main thread), you give others a chance to chime in (respond to user input). It makes the whole conversation much more interactive.
Optimise Your Event Handlers
The code that fires when someone clicks a button needs to be as fast as a lightning bolt.
- Debounce input events: For events that can fire rapidly, like someone typing into a search bar, you don't need to run a search function on every single keystroke. Debouncing is a technique that waits for the user to pause typing for a moment before executing the code, which prevents a ton of unnecessary work.
- Keep event listeners lean: The function tied to an event listener should do the absolute minimum amount of work required. If there are heavy calculations involved, offload them to run after the quick visual update has been painted to the screen.
Strategically Defer Non-Essential Scripts
Seriously, not every script needs to load the second your page opens. Those third-party scripts are often massive contributors to a poor INP.
- Use
asyncordeferattributes: Simply addingasyncordeferto your<script>tags for things like analytics or social widgets is a game-changer. It tells the browser to download them in the background without blocking that all-important main thread. - Lazy-load third-party components: Does that chat widget or video player really need to load for every single visitor? Of course not. Only load it when the user actually scrolls near it or explicitly clicks a button to open it.
By systematically finding and squashing these responsiveness bottlenecks, you ensure your website feels quick, professional, and intuitive. This directly boosts a user’s perception of quality and trust, making it a critical part of any successful technical SEO: the Core Web Vitals & page experience playbook.
Tackling Cumulative Layout Shift (CLS) to Build User Trust
Cumulative Layout Shift, or CLS, is the silent assassin of user trust. We’ve all been there: you go to click a button, and at the last second, a banner ad loads, pushing everything down and making you click on something completely different. It's frustrating, feels unprofessional, and can make your site seem broken.
Nailing this part of the technical SEO: the Core Web Vitals & page experience playbook is all about creating a stable, predictable visual experience for your visitors. It’s a powerful signal that your site is reliable and well-built. The goal is a CLS score of 0.1 or less – hitting that 'Good' threshold is non-negotiable if you want to build genuine user confidence.
How to Pinpoint CLS Issues
Before you can fix your layout, you first need to play detective and find out what’s actually moving around. The usual suspects are elements that pop into existence without warning, like images, ads, or content injected after the initial page load.
Here are the tools I rely on to hunt down these problems:
- Google Search Console: Start here. The Core Web Vitals report is fantastic for getting a bird's-eye view. It groups URLs with similar CLS problems, so you can quickly understand the scale of the issue across your whole site.
- PageSpeed Insights: Once you’ve identified a problem area in Search Console, plug a specific URL into PageSpeed Insights. It gives you both lab and field data for CLS and, crucially, often points a finger directly at the elements causing the biggest shifts.
- Chrome DevTools: For hands-on, real-time debugging, nothing beats DevTools. Open the 'Performance' panel, record a page load, and it will visually highlight every layout shift as it happens. You can see exactly what moved and when.
Using these tools in tandem allows you to go from a vague, site-wide problem to knowing the exact image or container that’s misbehaving on a specific page.
Common CLS Offenders and How to Fix Them
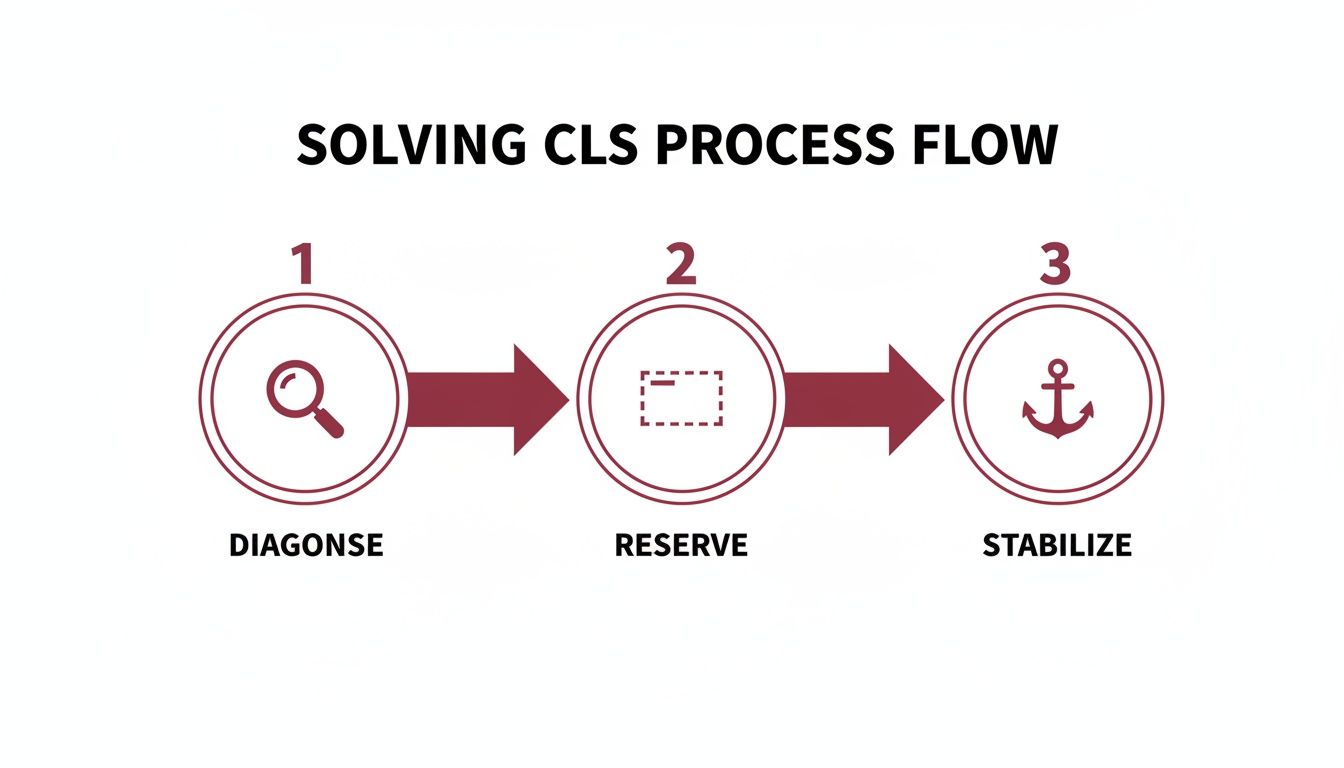
Once you know what's causing the instability, the fixes are usually quite straightforward. The core idea is to simply tell the browser how much space an element will need before it actually loads.
Reserve Space for Images and Videos
This is, by a country mile, the most common cause of CLS. An image tag without dimensions is a mystery box to the browser. It doesn’t know how much room to save, so when the image finally arrives, it has to shove all the surrounding content out of the way. Chaos ensues.
The fix is beautifully simple: always include width and height attributes on your <img> and <video> tags.

Even if you’re using CSS to make your images responsive, adding these HTML attributes is vital. The browser uses them to calculate the aspect ratio and reserve the correct amount of vertical space from the get-go.
Think of it like this: by setting explicit dimensions, you’re giving the browser a blueprint of the page layout right away. This prevents that jarring reshuffle of content and is probably the single highest-impact fix you can make for your CLS score.
Tame Your Web Fonts
Ever watched text on a page load in one font, only to flash and resize into another a second later? That's often a web font kicking in, and it can cause a nasty layout shift. This "Flash of Unstyled Text" (FOUT) or "Flash of Invisible Text" (FOIT) happens when the fallback system font is a different size or shape than your final web font.
To get this under control, you can:
- Preload key font files: Use
<link rel="preload">in your site's<head>. This tells the browser to grab your most important font files with higher priority, minimising the time your page spends showing a fallback font. - Use the
font-display: optionalproperty: This is a clever CSS trick. It gives the font a tiny window to load. If it doesn’t make it in time, the browser simply sticks with the fallback font for that session, completely avoiding the font-swap that causes the layout shift.
Stabilise Dynamic Content and Third-Party Ads
Things that get injected into the page dynamically are notorious CLS culprits. Think ad banners, related product carousels, or those cookie consent notices that pop up at the top of the screen. If you haven't saved a spot for them, their sudden arrival will shove everything else down the page.
The solution here is to create a placeholder. Wrap the ad slot or dynamic section in a container <div> and use CSS to give it a specific min-height. This way, the space is always accounted for in the layout, even if the ad is slow to load or doesn't show up at all. The surrounding content remains perfectly stable.
This attention to visual stability isn't just a technical exercise; it has a real commercial impact, especially in the competitive Australian e-commerce market. In fact, local e-commerce sites that met Core Web Vitals thresholds in 2023 were 24% less likely to have users abandon their visit. This really drives home how much a solid page experience matters to your bottom line. You can read more about the findings and their impact on Aussie retailers to get the full picture.
Building Your Core Web Vitals Monitoring Workflow
Getting your Core Web Vitals into the green is a great first step, but the job is never truly done. Think of it less like a one-off project and more like ongoing maintenance. A single site update, a new third-party script, or even subtle shifts in how your customers browse can cause your scores to slip. That's why building a solid, repeatable monitoring workflow is such a non-negotiable part of any serious technical SEO: the Core Web Vitals & page experience playbook.
Your workflow needs to pull from two different data sources to give you the full picture. First, you have lab data, which you get from tools like Lighthouse. This is fantastic for debugging in a controlled setting before you push changes live. But the real source of truth is field data, which comes from the Chrome User Experience Report (CrUX). This is data from your actual visitors, and it's what Google looks at for ranking. You'll find this data front and centre in your Google Search Console.
Choosing Your Diagnostic Tools
Having the right tools in your belt is essential for keeping a constant pulse on your site's health. They all do slightly different things, so knowing when to use each one will make your monitoring far more effective.
Core Web Vitals Diagnostic Tools Comparison
To get a clearer picture, it helps to see how the main tools stack up against each other. Each one offers a different perspective on your site's performance, and using them together gives you a complete diagnostic toolkit.
| Tool | Data Type | Best For | Key Limitation |
|---|---|---|---|
| Google Search Console | Field Data (CrUX) | Identifying site-wide trends and problem URL groups over a 28-day period. | Data is aggregated and delayed, so it’s not ideal for real-time debugging of specific fixes. |
| PageSpeed Insights | Lab & Field Data | Getting a quick, combined performance snapshot for a single page. Great for validating fixes. | Field data is only available for pages with sufficient traffic, which can be an issue for smaller sites. |
| Lighthouse (Chrome DevTools) | Lab Data | In-depth, real-time debugging during development with detailed technical recommendations. | The results are from a simulated environment and can vary based on your own network and device. |
As you can see, there's no single "best" tool. A powerful workflow often starts with Google Search Console to spot overarching trends, then moves to PageSpeed Insights to zoom in on specific problem URLs, and finally uses Lighthouse to really dig into the technical nitty-gritty and fix the root cause.
My go-to process is this: Use GSC to find the fires, PSI to confirm the smoke is real, and Lighthouse to get the water hose out and solve the problem for good.
Establishing a Reusable Audit Checklist
To stay on top of things without getting bogged down, create a simple, repeatable checklist. This isn't about doing a massive technical audit every week; it's about consistency and catching issues before they spiral. You can learn more about the bigger picture by exploring the master framework for technical SEO audits in 2025.
A simple, effective checklist might look like this:
- Weekly Check-in: Spend 15 minutes in your GSC Core Web Vitals report. Are there any new URLs popping up in the "Poor" or "Needs Improvement" buckets?
- Post-Deployment Scan: Just updated a plugin or changed your site's theme? Run your most important pages (homepage, key category pages, a product page) through PageSpeed Insights immediately to make sure you haven't accidentally broken something.
- Monthly Trend Review: At the end of each month, take a moment to compare your GSC data. Are your scores trending up or down? This high-level view helps you see the long-term impact of your efforts.
Interpreting Trend Reports to Prevent Regressions
The real magic happens when you spot a problem early. If you see a sudden spike in "Poor" LCP URLs in your GSC report, it’s time to play detective. Line up the date of the drop with any recent changes to your website. Did you add a heavy new hero image? Did a marketing app automatically update? This is where you connect the dots.
There’s a massive opportunity here for businesses that take this seriously. An incredible 96% of websites fail to get good scores across all three Core Web Vitals. Analysis of over two million URLs revealed that a tiny 4% actually hit Google's targets. For Australian small businesses and e-commerce stores, simply getting this right is a huge competitive edge.
Your Core Web Vitals Questions Answered
Diving into technical SEO often brings up more questions than answers. Let's cut through the jargon and tackle some of the most common things business owners ask about Core Web Vitals.
How Often Should I Check My Core Web Vitals Scores?
For most local and e-commerce businesses here in Australia, checking your Google Search Console report once a month is a good rhythm. This gives you enough time to spot genuine trends rather than reacting to every tiny daily blip.
The exception? If you've just launched a new website or rolled out a major update. In that case, it’s smart to check in weekly for the first month or so. You can use PageSpeed Insights to get instant "lab" feedback on specific pages, but always remember that Search Console's 28-day field data is the real benchmark. That’s what your actual visitors are experiencing.
Do I Need a Perfect 100 Score on PageSpeed Insights?
Honestly, no. Chasing a perfect 100 score on a tool like PageSpeed Insights can become a massive time sink with diminishing returns. It's a fantastic diagnostic tool for developers, but it's not the final exam.
Your real target should be getting all three Core Web Vitals metrics – LCP, INP, and CLS – into the 'Good' (green) zone using field data. This is the data gathered from real people on real devices visiting your site, and it's what Google actually cares about for rankings. Aim for consistently 'Good' user experiences, not an abstract 'Perfect' lab score.
My Rankings Are Fine, but My CWV Scores Are Terrible. Why?
I hear this a lot, and it's a great question. Page Experience (and Core Web Vitals within it) is just one piece of a much larger puzzle. Your site could be ranking well because it's killing it in other areas – maybe you have amazing, in-depth content, strong domain authority, or a killer backlink profile. These factors can absolutely outweigh poor performance scores for a while.
But think of it as a vulnerability. In a tight race where your competitors also have great content and authority, a better Page Experience can be the deciding factor that pushes them ahead of you. Fixing your Core Web Vitals isn't just about climbing higher; it's about defending the rankings you already have.
What’s the Difference Between Lab Data and Field Data?
Getting your head around this is crucial for making sense of any technical SEO: the Core Web Vitals & page experience playbook.
-
Lab Data: This is what you get when you run a test in a tool like PageSpeed Insights or Lighthouse. It’s a performance snapshot taken in a controlled, simulated environment. It's perfect for debugging because the conditions are always the same, which helps you isolate problems.
-
Field Data: This is the good stuff. It's performance data collected from actual Chrome users who have opted-in to share their data. It reflects the messy reality of their different phones, patchy Wi-Fi, and real-world locations. This is the data you see in Search Console, and it’s what Google uses for its ranking algorithm. It's your ultimate source of truth.
At Anitech, we specialise in turning these complex technical SEO problems into real business growth. If you’re ready to stop guessing and start implementing a strategy that gets your Core Web Vitals in the green, our team is ready to help. See how we can boost your site's performance and search rankings by visiting us at https://anitech.au.